Category: Economy

  • Time for Our Next Dose of Economic Castor Oil

    The Federal government released economic data for September late last week.   So, happy days are here again, right? The US economy is going great guns, yes?

    Two words:  um, no.   As has been the case for the last 7 years, the economy . . . remains in the freaking toilet.

    There was one change, though.  The US labor participation rate did not remain at 62.6% last month.  Rather, it declined further:  to 62.4%. Once again, that’s the lowest the US labor participation rate has been since October 1977 – or early in the Carter Administration. It also marks the 18th consecutive month that the labor participation rate has been at Carter-esque sub-63% levels.

    This means only 62.4% of the US civilian labor force is actually working or actively looking for work. As noted above, it’s also a 38-year low – which now has been the case for four straight months (July, August, and September’s labor participation rate of 62.6% were all previously tied for the lowest since October 1977).

    As noted above, the US labor participation rate has also been at or below 63% for a full   two years   18 months now.  We never saw that during Carter’s catastrophic economic mismanagement.

    And on top of that, job creation was far less than expected.  Meanwhile, the US “official unemployment rate” remained at 5.1%.

    That last is not good news.  The “official unemployment rate” remaining steady at 5.1% is not, as some might claim, in and of itself an indicator of economic progress. By itself, the “official unemployment rate” is absolutely worthless as a measure of the economy’s actual performance; it tells you virtually nothing about the underlying economic reality.

    That’s because the “official unemployment rate” – U3 – is calculated using only those who are “actively looking for work” but who are unable to find employment.  “Actively looking for work” is defined as looking for work within the last 4 weeks.  However, if someone has gotten completely discouraged and has quit even trying to find work, they’re not counted at all for U3 purposes.  The labor participation rate, in contrast, accounts for them.

    So, when the “official unemployment rate” stays steady at the same time job creation is too weak to keep up with new entrants, that means more people left the workforce than entered.  With a growing population, that implies a rather sick economy.

    Those who quit looking for work still exist, of course.  And at some point in the future, they’ll almost certainly start looking for work again.

    U3 is such a p!ss-poor measure of actual economic performance that it’s even possible for the “official” unemployment rate to decline at the same time the economy is actually losing jobs.  I’ve provided a short, simplified example showing how this can occur in this past article.

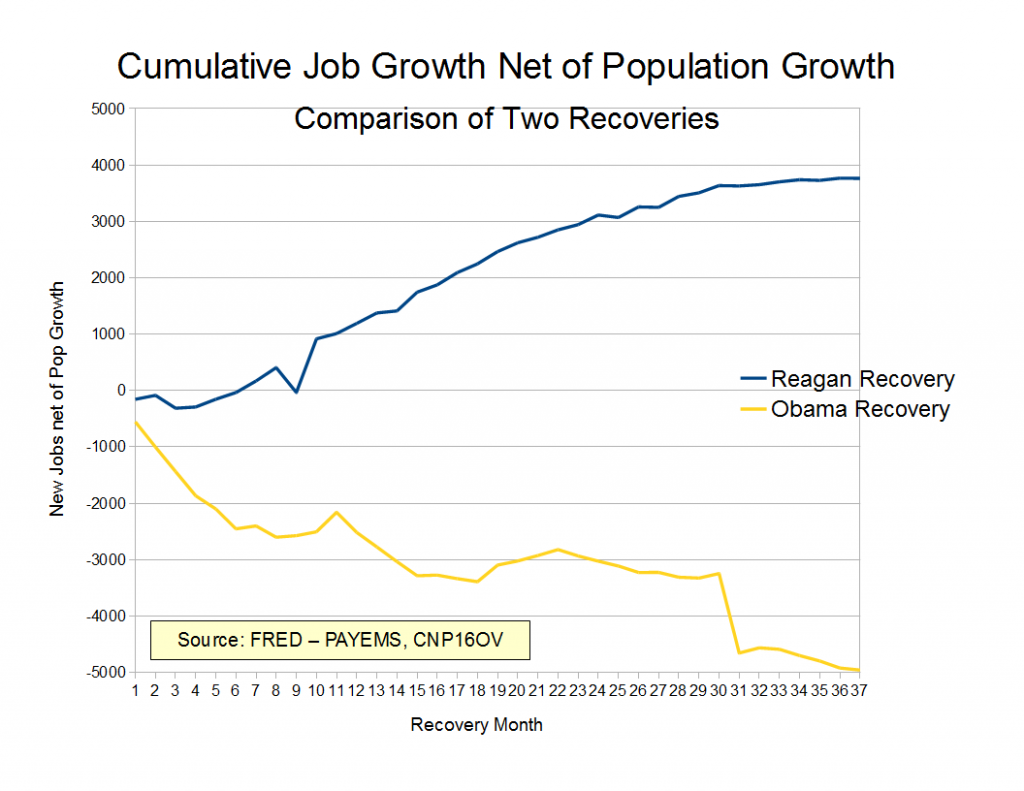
    That’s essentially what’s been happening over the past several years.  The US labor participation rate has gone down by 3.3% since January 2009.  Since there are roughly 251 million individuals in the US civilian labor force today, that means a huge number of Americans who should be out looking for a job have become so discouraged they simply aren’t even bothering to try.  However, if and when conditions actually show some real improvement many of them will start looking again – and the unemployment rate will jump.  That is when you’ll know a recovery has really started.

    One last bit of “good news”:  remember those “excellent” job creation numbers for August and September we heard so much about?  That were higher than projected?  For some reason, they were revised downward last month – substantially. Due to either error or design, the original numbers apparently were not even close to being correct.  And it gets even “better”:  those revisions now seem to indicate a possible 3-month downward trend in monthly job creation by the economy.  If that’s really the case, that’s NOT good news.

    Recovery?  The correct response to anyone who talks about any “current economic recovery” is exactly the same as it’s been for the past 7 years: “What freaking economic recovery?  So far, there hasn’t been an economic recovery.

    All we’ve seen is economic stagnation, along with people becoming discouraged to the point of giving up on even looking.  And on top of that, wages have been generally declining in real terms the whole time – and in current-dollar terms last month as well, though only slightly.

    It’s been almost 6 years and 9 months, Mr. President.  Are we ever going to see any real economic progress under your     group of feckless fools and clueless tools     Administration?

    Eh, don’t bother to answer.  I think we already know the score.

  • Yer Latest “Good Economic News”

    Well, the economic news for August is now out.  Short version:  the economy is still in the freaking toilet.

    For the third consecutive month, the US labor participation rate remained at 62.6%.  That means only 62.6% (the actual number, to 6 figures, calculates to 62.5518%) of the US civilian labor force is actually working or actively looking for work.

    This is a 38-year low – for the third straight month.  Prior to the last 3 months, the last time the US labor participation rate was this low or lower was October 1977.  Then, it was 62.4%.

    Yes, that does indeed read October 1977 – as in “during the worst of the Carter years”.

    It’s true that the “official unemployment rate” fell slightly last month, from 5.2% to 5.1%.  But that measure is absolutely worthless, because it tells you nothing about the underlying economic reality.  Here’s why.

    U3 – the “official unemployment rate” – is calculated using only those who are “actively looking for work” but who are unable to find work.  “Actively looking for work” is defined as looking for work within the last 4 weeks.  However, if someone has gotten completely discouraged and is no longer even looking for work, they’re not counted.  But they still exist.  And at some point in the future, they’ll be looking for work again.

    U3 is such a p!ss-poor measure that it’s even possible for this to cause the “official” unemployment rate to drop while you’re losing jobs overall.  I’ve provided a short example at the end to show how this can occur.

    That appears to be precisely what’s been going on for the past several years.  The US labor participation rate has gone down by 3.1% since January 2009.  That means a huge number of Americans simply aren’t even bothering to look for work that should be looking.  If the labor participation rate were the same today as it was in January 2009, an additional 7.78 million Americans would be in the labor force.

    Today’s US civilian labor force totals over 251 million.  Just for “fun”, let’s calculate what the “official” unemployment rate would be today if we had January 2009’s labor participation rate.

    In January 2009, the US labor participation rate was 65.7%.  If that were the case today, the US civilian labor force would be approximately 164,970,000. (Since the US labor participation rate today is only 62.6%, the civilian labor force today is only about 157,065,000.)

    However, today only about 149,055,000 Americans have jobs.  That means if we had a labor participation rate equal to that of January 2009, we’d have about 15,915,000 unemployed people who were actively looking for work today.

    Doing the math gives an unemployment rate of 9.64+% if we had the January 2009 labor participation rate of 65.7%. Since “official” unemployment in January 2009 was 7.8%, we’d need at least 4.5 million more jobs than exist today to get back to January 2009 economic conditions – and nearly 8 million more to achieve a 5.1% unemployment rate at January 2009’s labor participation rate.

    Oh, and we’re all also taking it in the proverbial shorts regarding purchasing power, too.  Per that wonderful bastion of conservatism called the New York Times, real wages (e.g., adjusted for inflation) have dropped since January 2009 in all earnings quintileswith the lowest-earning quintile seeing the largest real decline.

    Recovery?  What  freaking recovery? So far, there hasn’t been one.  All we’ve seen is stagnation, along with people becoming discouraged to the point of giving up.  Actual economic recovery?  Um. no.

    It’s been more than 6 and a half years since January 2009.  Are we ever going to see any real economic progress?

    . . . 

    Example Showing Loss of Jobs AND a Decline in “Official” Unemployment

    This simple example assumes no retirements and no new entrants into the job market during the two months in question.  In real world calculations, they’re considered – those are handled by adding new entrants and subtracting retirements, but the example is simpler and easier to follow if we omit those.  FWIW:  since the population is growing, there are typically more new entrants than retirements each month.  In the real world, new job creation must exceed the difference between new entrants and retirements or the unemployment rate will go up.

    First month

    These are the numbers at the beginning of the first month.

    Number unemployed and looking for work:  100,000

    Number with jobs:  900,000

    Labor Force:  100,000 + 900,000 = 1,000,000

    Unemployment rate:  100,000  / (100,000 + 900,000) = 10.0%

    Second month

    At the beginning of the second month, 25,000 jobs are cut.  However,  50,000 of the previous month’s “officially” unemployed people got fed up and quit looking for work 5 weeks ago – so they’re no longer counted.  The 25,000 who lost their jobs immediately start looking for new work.

    Number unemployed and looking for work:  100,000 (previous month) – 50,000 (quit looking)  + 25,000 (lost jobs, started looking)  =  75,000

    Number with jobs:   875,000

    Labor force:  75,000 + 875,000 = 950,000 (those who quit looking are no longer counted)

    Unemployment rate:  75,000 / ( 75,000 + 875,000) = 7.89%


    So, there was a net loss of 25,000 jobs in that month, but because enough people got fed up and quit looking for work  the “official” unemployment rate  dropped by 2.1+%.  Truly a great measure of economic conditions, eh?


  • The Economy Keeps On . . . Drifting Aimlessly

    Well, new job figures are out. And to anyone who actually knows their behind from a small intentionally shovel-excavated spot on the earth’s surface, the new figures for June 2015 are not exactly good news.

    Yes, “official” unemployment is now at 5.3%. But alone, that statistic tells you squat. Since “official” unemployment doesn’t count discouraged workers who’ve said “screw it” and quit looking for work, it is actually possible for the economy to lose jobs while unemployment goes down at the same time.

    That’s pretty much what happened last month. Unemployment went down because so many people said the hell with it and quit looking for a job – not because the economy created a plethora of new jobs (job creation was lower than during the previous month). Oh, and wages are effectively stagnant right now, too.

    The most meaningful number for gauging the state of the economy is the labor participation rate. And there, the news isn’t so good.

    The US labor participation rate is the fraction of the civilian labor force (more precisely, the civilian non-institutional population) that is either actually working or actively looking for work. Today, the US civilian labor force is 250,663,000. But of that group, only a total of 157,037,000 are actively participating today – 148,739,000 are working, while another 8,299,000 are actively looking for work.

    That’s a labor participation rate of 62.6%. The US labor participation rate hasn’t been that low since the first year of the Carter Administration – in October 1977, to be precise. That month it was 62.4%; it hasn’t been below 62.7% since.  Until last month, that is.

    Let’s put that in perspective. In January 2009, the US labor participation rate was 65.7%. If that were the case today, the US labor force would have 164,686,000 people either working or actively looking for work.  With 5.3% unemployment, a 65.7% participation rate would mean we’d need 156,397,000 people working – or about 7.65 million more jobs than exist today.  With the number that are working working today – 148,739,000 – if we had a labor participation rate of 65.7% we’d have a 9.7% unemployment rate.

    Even if unemployment today were the same as it was in January 2009 (7.8%), with a 65.7% labor participation rate we’d need about 152,770,000 people working. We’re well over 4 million jobs short of that, too.

    “Recovery”?  Yeah, right.  In the best measure of economic wellness – labor participation rate – the US economy is at freaking Carter Administration levels.

    And we’ve been at those levels for a while, too.  The labor participation rate has been stuck at Carter Administration levels since January 2012 – or for the last 3 1/2 years.

    “Recovery”?  What damn recovery?  The economy is still stuck in neutral, and has been for 3 1/2 years.  Before that, it was in free-fall for about 3 years.

    Call me when the labor participation rate has been rising consistently for a few months. Then we can talk seriously about an economic “recovery” having begun.

  • Two Bits of Economic “Good News” . . .

    . . . one short-term, and one long.

    The short-term “good news”: the US labor participation rate for April was 62.8%. That was indeed a slight increase from the previous month – and was slightly less than it was this month 37 years ago during the middle of the Administration headed by that “truly wonderful” POTUS,       Jimmah the Clueless       Jimmy Carter.

    Of course, longtime TAH readers know that is NOT exactly good news. Due to normal population growth, that also means we now have a record number of Americans eligible for the civilian labor force who aren’t even trying to work. The estimated number not working today who could be is 93,140,000.

    The labor participation rate for US women is also at a 27 year low. Due to population growth during the last 27 years, that in turn means the number of American women not working is also at an all-time high – approximately 56,167,000.

    The US labor participation rate is probably the best single common measure of the overall performance of the US economy (and even it is not complete). It’s been stagnant – mired at Carter-stagflation levels – staying at or below 63% for the past 18 months.

    Yeah, the “official” unemployment rate (U3) did go down a bit too.  But the “official” unemployment rate is effectively worthless as a measure of actual economic conditions. Follow it if it makes you feel better, but it won’t tell you much.

    As far as I’m concerned, I’ll get excited about the economy when the labor participation rate begins to show steady improvement over time. So far, it hasn’t. It’s been caught in Carter-doldrums territory, drifting aimlessly and without direction, for the past 18 months.

    But at least it’s stopped its free-fall. That only took this      clown krewe       Administration close to 5 years. Even Carter’s      ship of fools      Administration did better than that.

    Second, the long-term “good news”. Remember all those predictions that Social Security was going broke, and would have to cut benefits starting in less than 20 years? (When Social Security’s so-called “trust fund” is exhausted it becomes fully PAYGO, with outlays limited to income – which is predicted to be about 3/4 of what’s needed. When that happens, benefits in turn will be cut – or other funding will have to be found, through either more borrowing or even higher taxes.)

    Well, it seems as if some Ivy League researchers – at Harvard and Dartmouth – took a look at Social Security’s future projections. Their conclusion?

    Social Security’s own projections concerning it’s so-called “trust fund” appear to be biased and overly optimistic – and have been for well over a decade. The truth of the situation appears to be worse.

    Specifically, the researchers found that Social Security’s estimates of their trust funds’ financial health have been overoptimistic since around 2000. (emphasis added)

    “After 2000, forecast errors became increasingly biased, and in the same direction. Trustees Reports after 2000 all overestimated the assets in the program and overestimated solvency of the Trust Funds,” wrote the researchers, who include Dartmouth professor Samir Soneji and Harvard doctoral candidate Konstantin Kashin.

    The “so what”? The Social Security “trust fund” is what will temporarily make up the difference between Social Security’s tax income and benefits paid when Social Security’s tax income falls below outlays (and yes, Social Security is funded by current taxes – they’re called “FICA taxes”, and are assessed on the first $119,000 of wages earned). That will happen in a few years (2019 is the current projection), which means the fund will start being tapped in then. And Social Security itself projects that “trust fund” will be depleted by 2033.

    But if the “trust fund” isn’t in as good a shape as we’ve been told . . . it will likely be depleted earlier. How much earlier? Unknown.

    Bottom line: Social Security’s “trust fund exhausted” point might well be considerably closer than the the Social Security Administration’s own projected date of 2033. Joy, joy.

    Sorry for the “bummer” article today, but it’s better to be told the truth up-front than to get blindsided by reality.

  • Yet More “Economic Recovery” News

    Yeah, I know I had a similar article yesterday. But after the article was posted I saw these, and thought they were worth mentioning too.

    The Obama Economic Record: The Worst Five Years Since World War II – of particular interest to me is that an additional 7 million people became food stamp/SNAP recipients in 2010-2012, during a period of falling unemployment. Someone needs to ‘splain that one to me, ‘cause I just don’t “get it”.

    62.8%: Labor Force Participation Has Hovered Near 37-Year-Low for 11 Months – and that article is actually being generous. Since it’s now close to two months old, it only covered from Apr 2014 to Feb 2015 – and reality today is a bit worse. March 2015 figures showed a decline in the US labor participation rate to 62.7%. That makes a full year that the US labor participation rate has been in the Carter-esque economic toilet of being below 63%.

    • And to really “make your day” with good economic news, there’s this article, from Gateway Pundit. But if you want the “quick and dirty” version, this graph from the article tells you all you really need to know:

    Yeah, those economic “good times” certainly seem to be just around the corner, don’t they?

    I wonder if year 7 will be the “teh won” in which we see any real improvement? My advice, though, is: “Don’t hold your breath.”

    Sheesh. I am so damn ready for some adult leadership with a clue to return to DC.

  • And In “Economic Recovery” News . . . .

    Here are a few recent articles that show just how “swimmingly” the current       DC clown Krewe       Administration is managing our nation’s economy.

    In 1 in 5 Families in U.S., No One Works – you might want to check out the graph in this article, with particular attention to the period 2009-2014

    Homeownership rate lowest in 25 years – if you’re thinking that means it hasn’t been this low since the 1990 recession during the Bush (41) Administration . . . you’re correct.

    US economy stalls in Q1 as weather, lower energy prices bite – yeah, a 0.2% quarterly growth rate kinda qualifies as a “stall”.  But someone’s gonna have to explain to me how “lower energy prices” is a reason for reduced economic activity, though. Seems to me that lower prices should be good news.

    “Lassez les bontemps rouler”, eh? Yeah, right.

    Not likely unless we get some adult leadership again in 2017.

  • At Last – A Shovel-Ready Stimulus Project

    Remember that vaunted “economic stimulus” package from several years ago? You know, that one rammed through Congress by the      naive DC clown krewe      current Administration that was going to lassez les bontemps rouler again, economy-wise? And which hasn’t exactly worked out all that well?

    The 2009 economic stimulus program has been widely derided as ineffective. Many of those “shovel-ready” projects you heard about were anything but. Critics called many of the projects funded by the program “make work”, “pork”, or “crap”. And it looks like they were dead on target.

    However, in spite of the ineffectiveness of the program those stimulus funds apparently are still around (and we wonder why we’ve been having budget deficits approaching or over $1 trillion annually). And today we have a new stimulus-funded project that’s truly shovel-ready.

    It’s a contract issued by the Bureau of Land Management to haul off horse and burro manure.

    The contract has one base year and four option years. It will likely be in effect until 2019.

    I’m not joking.

    What a load of horsesh!t. Literally.

    And we’re the ones paying for it.

  • And In the “More ‘Good’ Economic News” Department . . . .

    New Record: Pound of Ground Beef Tops $4 for First Time

    It’s up 16.2% in the past year.

    Five years ago, ground beef averaged $2.134 per pound.  That’s an increase in 5 years of 88.1% – or an annual increase of more than 12.6% a year for five consecutive years.  And of course, we all know that salaries have kept pace.

    Yeah, that economic recovery is just plugging along – ain’t it?